Inside The Book
A closer look inside
Explore the twelve chapters, read an extract from Graham Samways' foreword and see examples of how the book brings dealership performance figures to life.
Contents at a Glance
Chapter 1 — Working Capital
Working capital is the starting point. A dealership can be profitable and still run into serious financial difficulty if it cannot meet its short-term commitments. We look beyond the Working Capital Ratio and follow the money into stock, debtors, creditors and borrowing. We examine why profit does not necessarily translate into cash and why matching the funding to the use matters.
Chapter 2 — Follow the Money
Having established where the money may be tied up, we broaden the investigation to Funds Employed. We look at where the money invested in the dealership is sitting, how it is financed and how effectively it is being used, introducing COFE — Circulation of Funds Employed — as “the stock turn of the money.”
Chapter 3 — The Relationship That Matters
Profitability on its own does not tell us how well a dealership is performing. Here we bring together sales, profit and investment and establish the relationship between profitability, COFE and ROFE. It demonstrates why two dealerships with apparently similar profitability can produce very different returns from the money employed in them.
Chapter 4 — Finding the Difference
Once we know that performance is inadequate, the investigation begins. Using the business plan, composites and other meaningful comparisons, we identify where actual performance differs from what we expected. We then follow those differences through profitability and COFE to establish where management attention is required, why the differences exist and what corrective action may be necessary.
Chapter 5 — Where Is the Profit Being Made?
An acceptable overall profit can conceal significant differences in departmental performance. We examine gross profit, departmental expenses and direct profit, and explore how overhead allocations and internal charging policies can distort the picture. By comparing departmental results with expectations and benchmarks, we identify where profit is being made, where it is being lost and where management attention is needed.
Chapter 6 — What Is It Costing Us?
Generating gross profit is only part of the story. The dealership also has to support the cost structure required to produce it. We look at overheads in relation to the activity and profit they support, identifying significant differences without falling into the trap of assuming that every high cost should simply be cut.
Chapter 7 — Is Aftersales Doing Its Job?
Service, parts and other aftersales activities have an important part to play in the financial strength of the dealership. Rather than treating absorption and departmental measures as isolated KPIs, we look at what aftersales contributes to the overall business and what the numbers make us ask when that contribution is below expectation.
Chapter 8 — Are the Assets Working Hard Enough?
Money tied up in stock, debtors, demonstrators, equipment and other assets has to justify its place in the business. Building on COFE, we look more closely at whether those assets are working effectively and how apparently operational decisions can affect cash, borrowing and ultimately the return on Funds Employed.
Chapter 9 — What Are the People Producing?
People are both a major cost and the means by which the dealership generates its results. The purpose is not simply to compare headcounts or payroll percentages, but to understand the relationship between people, activity, productivity and financial performance and to identify where the numbers suggest questions need to be asked.
Chapter 10 — A Closer Look at the Balance Sheet
A closer examination of the balance sheet can reveal what headline figures conceal. We consider property revaluations, shareholders’ equity and their effect on reported performance, as well as the quality of stock, debtors and other assets, asking what the figures really represent.
Chapter 11 — Reading the Whole Dealership
By this stage we have accumulated a great many numbers, but the purpose has never been to produce a collection of KPIs. We bring the different strands together and work through the dealership as a whole, looking for the relationships between profit, cash, stock, people, costs and Funds Employed and allowing one difference to lead us to the next.
Chapter 12 — The Story Behind the Numbers
We return to a simple consultancy approach: explain what you intend to do, carry out the work, then summarise what you have found. We bring together the principles developed throughout the book, showing how the numbers help us understand what is happening, identify where to look and ask the right questions — before management takes over and decides what to do about it.
Foreword by Graham Samways
I’m delighted that Graham Samways has written the foreword to Understanding Motor Dealership Performance. His perspective provides a fitting introduction to the book and its central theme: understanding the story behind the numbers.
“I have known Derek for almost 40 years both as a work colleague and as a friend.”
“His wisdom and experience shine through on every single page of this book.”
“What sets this book apart from existing literature is its innovative approach to analysing business performance without resorting to endless lists or incomprehensible jargon.”
“Rather than repeating accepted financial analysis theory, the author has simplified the concepts and explained the relevance of the key financial performance indicators.”
“The aim is not to make every departmental manager a financial expert, but to open their eyes to the financial consequences of operational decisions and what to monitor to ensure overall objectives are achieved.”
“I have thoroughly enjoyed reading this book and most enthusiastically recommend it. For motor trade managers this book will serve as an engaging, clear, and inspiring roadmap to a financial understanding of their business.”
Graham Samways
Extracts from the foreword
Which Dealership Performs Best?
Two dealerships each generate £10 million in annual sales and £250,000 in profit before interest.
Both report profitability of 2.5%.
Would you say they are performing equally well?
Before you decide, there is one more figure to consider.
Dealership A employs £1.25 million in the business. Dealership B employs £2 million to produce exactly the same sales and profit.
Does that change your answer?
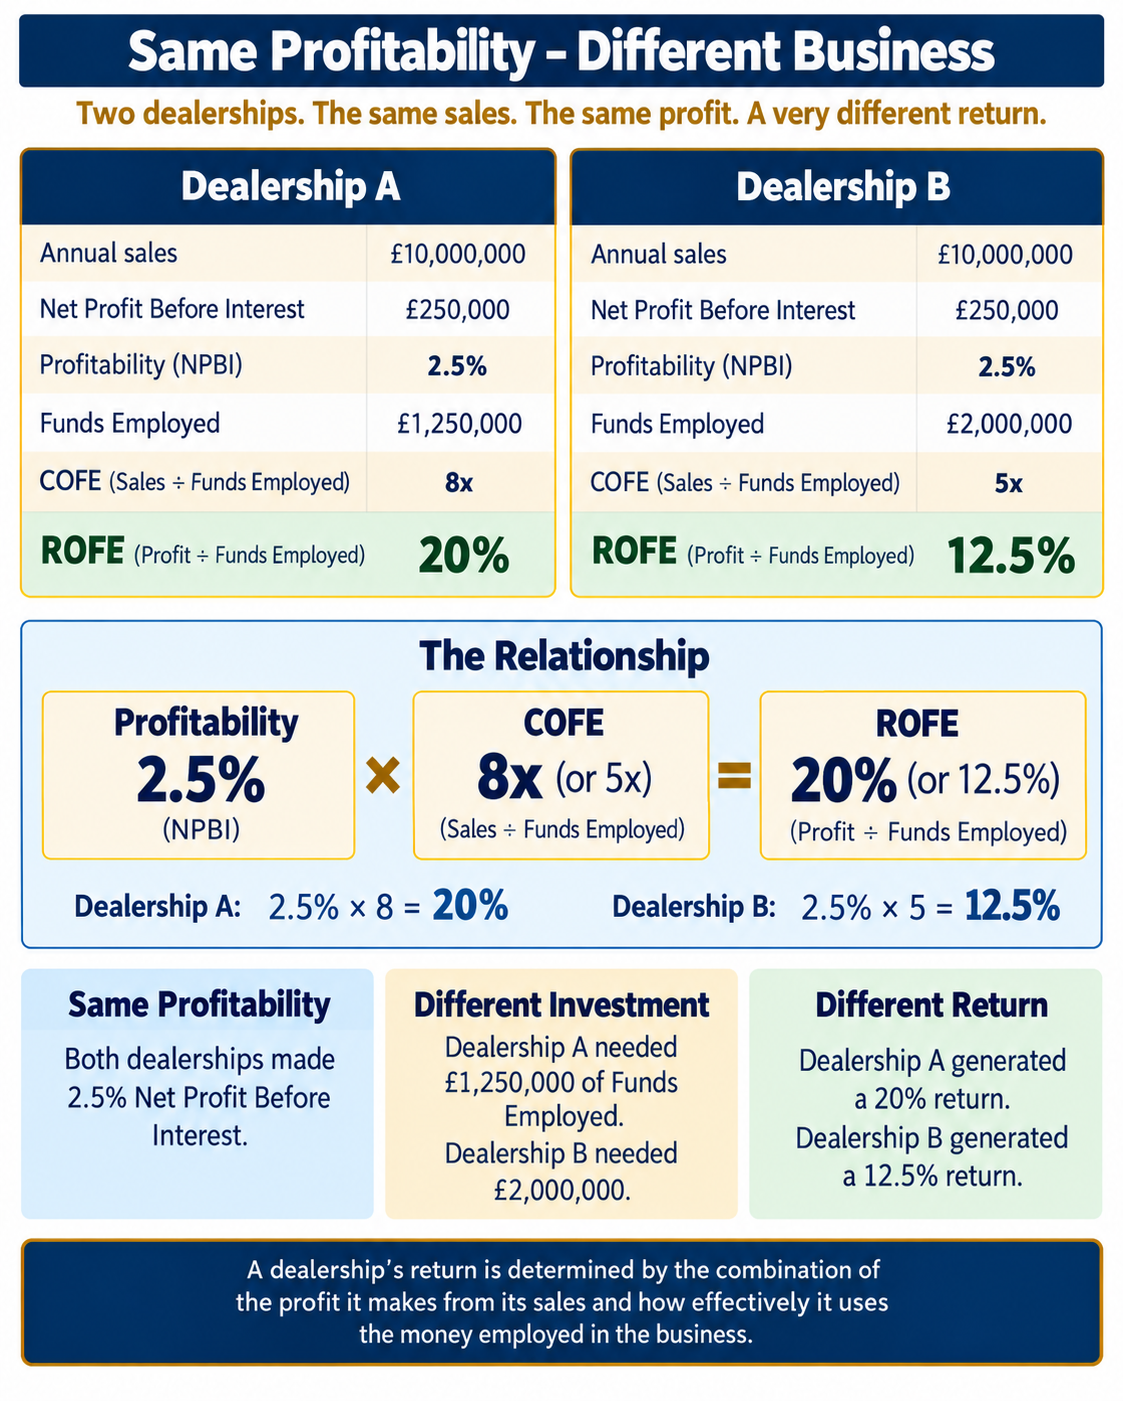
Dealership A earns a 20% return on funds employed. Dealership B earns 12.5%.
The same sales. The same profit. But a very different return.
The Special Relationship
A dealership’s return depends on both the profit it makes from its sales and how effectively it uses the money employed in the business.
Profitability × Circulation of Funds Employed = Return on Funds Employed
This is what I call the Special Relationship between Sales, Profit and Investment.
It helps us move beyond an individual performance measure to a more revealing question: is a weak return caused by insufficient profit on sales, too much money employed in generating those sales—or a combination of both?
Adapted from Understanding Motor Dealership Performance – The Story Behind the Numbers.